AGRICULTURE NEGOTIATIONS: BACKGROUNDER
Data
AS OF 1 DECEMBER 2004
For current news and information on the negotiations, please click here.
This briefing document explains current agricultural issues raised before and in the current negotiations. It has been prepared by the Information and Media Relations Division of the WTO Secretariat to help public understanding about the agriculture negotiations. It is not an official record of the negotiations.
Click the + to open an item.
This briefing document explains current agricultural issues raised before and in the current negotiations. It has been prepared by the Information and Media Relations Division of the WTO Secretariat to help public understanding about the agriculture negotiations. It is not an official record of the negotiations.
World trade in agricultural products, 2003
Value $bn |
674 |
|
Annual change % |
|
|
1980-85 |
-2 |
|
1985-90 |
9 |
|
1990-95 |
7 |
|
1995-2000 |
-1 |
|
2001 |
0 |
|
2002 |
6 |
|
2003 |
15 |
Share in world merchandise trade % |
9.2 |
Share in world exports of primary products % |
41.2 |
Source: WTO International Trade Statistics 2004, table IV.3, includes trade between EU members
back to top
Top 15 agricultural exporters and importers, 2003
|
|
Value |
Share
in world |
|
Value |
Share
in world |
| Exporters |
|
|
Importers |
|
|
|
EU members (15) |
284.14 |
42.2 |
EU members (15) |
308.87 |
42.8 |
|
EU to rest of world |
73.38 |
10.9 |
EU from rest of world |
98.11 |
13.6 |
|
United States |
76.24 |
11.3 |
United States |
77.27 |
10.7 |
|
Canada |
33.69 |
5.0 |
Japan |
58.46 |
8.1 |
|
Brazil |
24.21 |
3.6 |
China |
30.48 |
4.2 |
|
China |
22.16 |
3.3 |
Canada c |
18.02 |
2.5 |
|
Australia |
16.34 |
2.4 |
Korea, Rep. of |
15.56 |
2.2 |
|
Thailand a |
15.08 |
2.2 |
Mexico |
13.85 |
1.9 |
|
Argentina b |
12.14 |
2.1 |
Russian Fed. a |
13.73 |
1.9 |
|
Malaysia |
11.06 |
1.6 |
Hong Kong, China |
10.81 |
- |
|
Mexico |
9.98 |
1.5 |
retained imports |
6.47 |
0.9 |
|
|
|
|
Taipei, Chinese |
7.96 |
1.1 |
|
Indonesia |
9.94 |
1.5 |
Switzerland |
7.12 |
1.0 |
|
New Zealand |
9.60 |
1.4 |
Saudi Arabia |
6.26 |
0.9 |
|
Russian Fed. a |
9.37 |
1.4 |
Thailand a |
5.72 |
0.8 |
|
Chile |
7.47 |
1.1 |
Indonesia |
5.44 |
0.8 |
|
India a |
7.03 |
1.2 |
Turkey |
5.22 |
0.7 |
|
Above 15 |
548.44 |
81.8 |
Above 15 |
580.44 |
80.4 |
Source: WTO International Trade Statistics 2004, table IV.8. “EU members” includes trade between EU members
a Includes WTO Secretariat estimates. |
b 2002 instead of 2003 |
c Imports are valued f.o.b. |
back to top
Agricultural products’ share in trade, by region, 2003
|
|
Exports |
Imports |
Exports |
Imports |
|
|
Share in total merchandise trade, % |
|
|
Share in |
|
|
|
World |
9.2 |
9.2 |
World |
41.2 |
41.2 |
|
North America |
11.0 |
6.2 |
North America |
56.6 |
32.2 |
|
Latin America |
19.8 |
9.7 |
Latin America |
47.2 |
44.0 |
|
Western Europe |
9.6 |
10.4 |
Western Europe |
57.6 |
48.3 |
|
C./E. Europe/Baltic States/CIS |
8.8 |
10.1 |
C./E. Europe/Baltic States/CIS |
22.7 |
47.6 |
|
Africa |
13.9 |
15.9 |
Africa |
20.2 |
59.4 |
|
Middle East |
3.4 |
12.4 |
Middle East |
4.4 |
68.0 |
|
Asia |
6.3 |
8.9 |
Asia |
46.3 |
33.2 |
Source: WTO International Trade Statistics 2004, table IV.5, includes trade between EU members
back to top
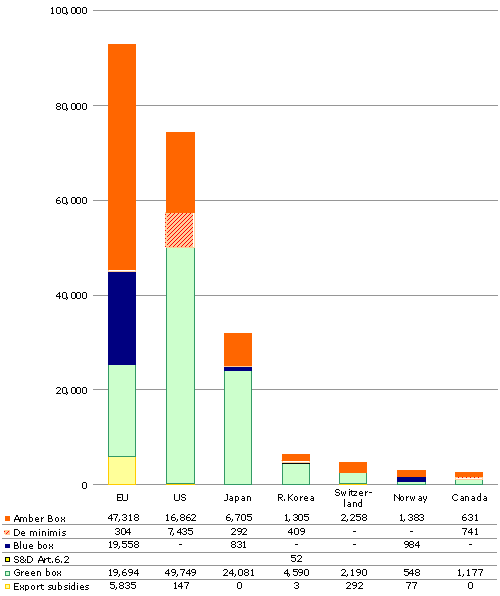
How much do they spend?
Notified domestic support, 1999, and export subsidies, 1998. US$ million

Source: member governments’ notifications to WTO
Want
to download and print this backgrounder?
> Download here
