- home
- wto news
- 2003 press releases
- press release

Press/337
22 April 2003
WORLD TRADE FIGURES 2002
Trade recovered in 2002, but uncertainty continues
Driven by strong demand in the United States and the big Asian economies, merchandise trade grew by 2.5% in 2002, up from a 1% decline in 2001, according to the latest WTO figures.
Considerable uncertainty clouds trade growth prospects for 2003. Early indications suggest that at less than 3%, growth in trade volume for 2003 will be little or no better than 2002. This is well below half the average rate of trade growth achieved in the 1990s (6.7%). The downside risks on predictions for 2003 are large, bearing in mind continued sluggishness in the world economy, the conflict in Iraq, and the possibility of the continuing spread of the Severe Acute Respiratory Syndrome (SARS).
These trade figures reflect the growing economic and political uncertainty in the world today. This uncertainty is detrimental to economic growth and development and can give rise to greater instability across the globe. Governments must send a signal that they are prepared to address this problem. One very important contribution to this effort would be to accelerate work on the negotiations in the Doha Development Agenda,?said Director-General Supachai Panitchpakdi.
Launched in November 2001 by ministers meeting in Qatar, the Doha Development Agenda comprises a wide range of negotiations on topics including agriculture, development issues, trade in services, industrial tariffs, WTO rules and trade and environment. Progress in these talks has been uneven and with the talks due to conclude by 1 January 2005, Director-General Supachai has urged the 146 member governments to summon the political courage that is required to bridge differences across the negotiations.
The WTOs assessment of the 2002 trade figures is based on the first preliminary compilation of statistics for the past year. Measured in value terms, merchandise exports rose by 4% to $6,240 billion nearly offsetting the decline of the preceding year. Commercial services trade expanded a little faster than merchandise trade reaching a new record level of $1,540 billion.
The trade recovery occurred amidst the weakness of the global economy, greatly reduced investment flows, major movements in exchange rates, dented business confidence, increased restrictions on international trade transactions to reduce risks from terrorism and rising geopolitical tensions.
The rise in trade in commercial services took place despite the lingering fear of terrorism and higher fuel prices which limited growth in international travel and transportation services. But this was more than made up for by trade in other services which continued to expand rapidly.
The weakness of fixed investment expenditure contributed significantly to the sluggish overall growth in the industrial countries. Worldwide expenditures on electronic equipment, IT hardware and semi-conductor plants continued to shrink.
The global economic recovery proved uneven, with significant differences in growth performance across regions. The driving forces of the pick up in global economic activity were the United States, the advanced economies in East Asia, China and the transition economies. In contrast, Western Europe and Japan experienced stagnation or a decline in domestic demand. In Latin America, crises in Argentina and Venezuela contributed to the severe slump.
Trade performance largely mirrored the pattern of economic growth. Trade expansion was strong in Asia and the transition economies. North Americas imports recovered in line with stronger domestic demand although exports decreased in 2002. Trade remained stagnant in Western Europe and Japan. And it contracted in Latin America as a result of economic turmoil in a number of countries in the region.
Some details of developments in specific countries or groups of countries:
- Developing
Asias merchandise trade grew by about 12.5% in volume terms, driving
the entire continents exports and imports to grow by double digits.
The region also saw diverging growth paths between Japan, still Asias
largest economy, and China and India, the two most populous nations in
the world. In value terms, Chinas merchandise exports and imports
increased by more than 20% while Indias also grew at double-digit
rates. China has overtaken the UK to become the fifth largest trader
in the world. Japans merchandise export growth was only 3% while
imports contracted.
- Transition
economies?trade continued to show strong growth with merchandise
trade expanding by about 10% lifted by strong domestic demand growth
and by rising foreign direct investment (FDI) inflows into the region.
- Imports into
the US grew by 3% driven by continuing consumer spending and an
increasingly expansionary fiscal stance. But exports declined by
nearly 4% partly reflecting reduced demand from some key trading
partners whose economies were either hardly growing, such as Western
Europe and Japan, or in outright contraction, as in Latin America.
Lack of price competitiveness might have also played a major role as
US exports decreased even to those regions whose imports grew
strongly.
- Western
Europes trade stagnated in volume terms with merchandise exports
increasing by just 0.6% and imports declining by 0.5%.
- Latin America
saw one of its worst years with the crises in Argentina, Venezuela and
difficulties in Brazil in the run-up to the national elections. Latin
Americas merchandise imports declined by over 5% in 2002 although
merchandise exports rose by about 2% with the decline in
intra-regional trade (especially intra-MERCOSUR trade) being balanced
by increased shipment to other regions.
- LDC exports
and imports rose last year although it does not change their overall
situation as marginal participants in world trade.
- Oil exporting LDCs saw a strong increase in the dollar value of their shipments as they increased their production and volume of trade. Exports of the non-fuel commodity exporting countries continued to rise after marked gains in 2001. However, exporters of manufactured goods experienced stagnation.
Prices
of crude oil, gold and agricultural commodities rose in 2002 providing
an important lift to commodity exporting developing countries. However
prices of minerals and metals continued to fall. Prices of manufactured
goods recovered somewhat but were still around 10% below their level in
1995.
In the course of 2002, the real effective exchange rate of the US
dollar depreciated while the euro and the yen appreciated. However, the
realignments did not seem to have materially affected the US trade
deficit, nor current account surpluses being accumulated by the euro
zone countries, Japan and developing Asia.
International capital flows had risen throughout the 1990s and
peaked in 2000. Since then they have experienced a drastic contraction.
Both developed and developing regions have been affected by the
reduction in FDI flows. Noteworthy exceptions were FDI inflows to China
and to Central/Eastern Europe which continued to increase very strongly.
These are the details:
Trade developments in 2002
The global economic situation in 2002
Chart1
Expansion of trade and output slows in fourth quarter 2002
(Percentage change on a quarter to quarter basis)
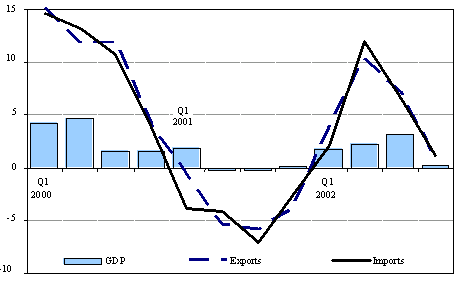
The global economic recovery was uneven and lost steam in the second
half of 2002 limiting full-year growth of world output to only 1.5%. The
driving forces of the pick up in global economic activity were the
strength of the domestic demand recovery in the United States and the
advanced economies in East Asia. The expansion of world GDP was also
sustained by both China and the transition economies which continued to
record much faster economic growth than the world economy. In sharp
contrast, Japan and Western Europe continued to experience stagnant or
declining domestic demand growth. And Latin Americas economy plunged
into a recession largely brought about by the crises in Argentina and
Venezuela. The per capita income in the region declined for the second
consecutive year.
In the industrial countries, the main expenditure categories of GDP
differed markedly in behaviour during the cyclical slowdown and
recovery. The run down in inventories and their replenishment in 2002
was the most outstanding factor in last years cyclical recovery.
Inventory changes in the OECD reduced GDP growth by 0.8% in 2001 but
added 0.2% to GDP growth in 2002. In the US, public consumption expanded
by 3% and was also the fastest growing component of demand in the
industrial countries. Private consumption in the OECD area continued to
rise by 2% in 2002 as the acceleration of consumer demand in the US was
balanced by the slowdown in both Japan and Western Europe. A major
element in the weakness of the recovery was the continuing contraction
of non-residential investment which was even more pronounced last year
than in 2001.
The threat of terrorism has led many governments and companies to take
various measures to enhance security and to limit the risks of future
terrorist attacks. Some of these measures have resulted in restrictions
on the movement of persons and goods. The cost not only involves the
direct expenditures for these security measures which governments and
companies must put in place but the indirect impact on trade in the form
of more cumbersome procedures and delays. The increase in geopolitical
risks and tensions has also taken its toll on international trade
through the recent run-up in oil prices.
The sluggishness of economic activity and the widespread excess capacity
prevailing in the manufacturing sector contributed to a further decline
in inflation rates (1). Inflation rates decreased slightly in Western
Europe, North America and Asia. While consumer prices in the transition
countries receded markedly, from what were sometimes double-digit rates,
they increased in South and Central America under the impact of currency
devaluations. As global economic growth lagged behind both productivity
and labour force growth, unemployment and underemployment
worsened in most regions. Recorded unemployment rates rose in North
America, Western Europe and Japan. In the latter country, the
unemployment rate reached an historic record level of 5.5%, more than
twice the level reported in the early 1990s. In Latin America, the steep
decline in output has led to a sharply worsened employment situation.
According to CEPAL the average urban unemployment rate in the region
increased to 9.1% , the highest rate observed in the 1990s. (2)
The marked differences in domestic demand growth between the United
States, developing Asia and the transition economies on the one hand and
Japan, Western Europe and Latin America on the other hand contributed to
major shifts in the trade and current account balances. Japan and
Western Europe recorded an expansion of their net exports. Consequently
(the trade and) current account surpluses of Japan and the EU widened
with increases equivalent to 1% and 0.7% of GDP respectively. Under the
impact of sharply lower capital inflows, Latin America had to cut its
imports which led to a trade surplus and reduced the regions current
account deficit. The United States?current account deficit widened to
more than $500 billion or 5% of GDP, which was an historic peak in
absolute and relative terms.
International capital flows had risen throughout the 1990s and
peaked in 2000. Since then they have experienced a drastic contraction.
This can be illustrated by the pronounced rise and fall in foreign
direct investment (FDI). Total FDI flows surged from about $200 billion
in the early 1990s to almost $1.2 trillion in 2000. In 2001, the value
of these flows collapsed by about 50%, and in 2002, by another 25%
falling back to about $500 billion, a level first reached five years
ago. Both developed and developing regions have been affected by the
reduction in FDI flows. Only FDI inflows to China and to Central/Eastern
Europe continued to increase.
In the course of 2002, the real effective exchange rate of the US
dollar depreciated while those of the euro and yen appreciated. In the
medium term, the depreciation of the US dollar, after its nearly 20%
rise between 1995 and 2001, could contribute to arresting the steady
increase in the US trade deficit. One aspect of the dollar decline
vis-?vis the currency of major traders is the inflationary?impact on
world trade prices measured in dollar terms. Although intra-EU trade
stagnated in 2002 in euro terms, it recorded an increase of nearly 5%
measured in dollar terms. The overall impact of exchange rate
developments on trade values in 2002 contrasts with the tendency
prevailing between 1995 and 2001 when the dollars appreciation had the
impact of deflating?world trade prices measured in dollar terms.
Consequently, for the first time since 1995, the dollar prices of
internationally traded agricultural and manufactured goods showed an
annual increase. Oil prices recovered from their trough in early 2002
with annual average prices for 2002 marginally exceeding those of the
preceding year. Prices for metals continued to decline, particularly for
aluminium, the most heavily traded metal. The recovery in food prices
was the net outcome of higher prices for all types of cereals, soybeans
and vegetable oils, which outweighed the price reductions in meat,
seafood, sugar and tropical fruits. Prices for cereals, in particular
wheat, rose as droughts in four of the five traditional exporting
regions caused a decline in production for the second year in a row.
Trade recovery exceeds output recovery
The pick up in global economic activity went together with a rebound of
international trade flows. Based on preliminary estimates, world
merchandise exports rose in real terms by 2.5% in 2002 after the
contraction in the preceding year. Although global trade recovered
faster than output, the expansion was less than half the average rate
recorded in the 1990s. The annual average growth rates conceal the steep
decrease of global trade in the course of 2001 and its rapid recovery
between the last quarter of 2001 and the third quarter of 2002. In the
fourth quarter of 2002, there was a notable flattening of trade growth
for both the United States and Western Europe.
A major element in the more subdued expansion of trade in the last
quarter of 2002 was the continued sluggishness of investment in the
major developed markets and in Latin America. The continued contraction
of new investment in machinery and equipment in 2002 can be linked to
low capacity utilization rates in the manufacturing sector, and in
particular, in information technology and telecommunication equipment.
Worldwide expenditures on electronic equipment, IT hardware and
semi-conductor plants continued to shrink (3). The repercussions of the
decline in investment expenditure on trade flows can be illustrated by
the continuing decline in the volume of US imports of capital goods in
2002, while US imports of all other products recovered by 6%. (4)
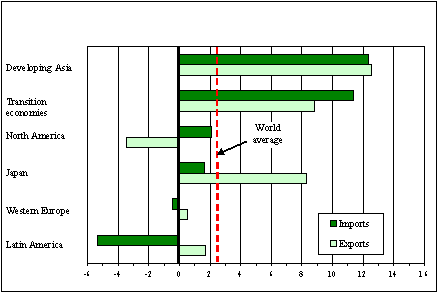
Chart 2
Trade recovers more strongly than output in 2002
(Annual percentage change)
Largely due to sluggish investment expenditures, trade expansion
(average of exports plus imports) in both North America and the Western
Europe lagged behind their GDP growth. In Asia and the transition
economies, however, trade volume expanded at least two times faster than
output, which was in each case well above the global average. The
strength of these regions?trade growth, which was around 10% in 2002,
stemmed largely from the vigorous expansion of domestic or
intra-regional demand. The performance of these two regions explains why
global trade expanded faster than output in 2002. In contrast, Latin
Americas output decline caused a contraction of its imports in the
order of 6% while exports continued to grow despite shrinking
intra-regional trade because of the expansion of trade with countries
outside the region. On the whole, both trade and output declined in
Latin America, with trade decreasing more than output.
The largest single element in the global trade recovery of last year was
North American, and in particular, US import growth. US merchandise
imports account for one fifth of world trade but the increase in 2002
was equivalent to one half of the global trade expansion. Relatively
buoyant private and public consumption growth continued to stoke US
import demand. Developing Asia and the transition economies, which were
the regions with the highest GDP growth, also contributed strongly to
the growth in imports. Developing Asias imports rebounded by 12.5%
following a contraction in the preceding year. Two factors can be
singled out for this dramatic reversal. First, the surge of FDI inflows
in the aftermath of Chinas accession to the WTO resulted in a jump in
Chinas real imports by nearly a quarter. And second was the recovery of
imports in the developing East Asian IT traders of nearly 9% (after a
decline of 8.5% in the preceding year). As regards the transition
economies, most of the strength was contributed by Russian demand
although import strength was broad-based with more than half of all
transition economies experiencing double-digit growth.
The recovery of global trade was retarded by the stagnation of Western
Europes imports and a contraction of Latin Americas imports. Among the
Western European countries, imports shrank or stagnated in France,
Germany, Spain and Switzerland. Some smaller Western European economies,
such as Belgium, Denmark, Ireland and Finland, however saw relatively
buoyant import expansion. A reduction of net-capital inflows into Latin
America forced the region to cut back its current account deficit. This
was achieved primarily by a fall in imports in the order of 5% and a
rise in extra-regional exports.
Chart 3
Large variations in trade volume growth by region in 2002
(Annual percentage change)
Price and exchange rate changes help raise global trade values
The recovery in the volume of trade combined with a moderate increase in prices of internationally traded goods resulted in a rise in the value of world trade. Merchandise and commercial services exports rose by 4% and 5% respectively in 2002. However, these rates of nominal trade expansion remained below the average recorded in the 1990s. For merchandise trade, the expansion in 2002 offset the decrease reported in the preceding year while commercial services trade reached a new peak level. For world merchandise exports, available data point to an above average rise in the exports of manufactured goods and a below average increase for both mining and agricultural products. Among the categories of commercial services, exports in the largest category, other commercial services, expanded significantly faster than those of travel and transportation services.
Table 1
World exports of merchandise and commercial services, 1990-2002
(Billion dollars and percentage)
|
Value |
% |
|||
| 2002 | 1990?000 | 2001 | 2002 | |
| Merchandise | 6 240 | 6 | ? | 4 |
| Commercial services | 1 540 | 7 | ? | 5 |
As inflation and exchange rates evolved quite differently by region, developments in nominal merchandise trade differ from those in volume terms. This is most evident in the case of Western Europe whose exports in volume terms stagnated at 0.6% while its exports in value terms increased by 5.5%. The difference can be attributed almost entirely to the 5% depreciation of the dollar against the euro and other Western European currencies. Asia and the transition economies had the strongest export value growth of all regions followed by Western Europe. North America reported the largest export contraction of regions while imports recovered by 1.7%. The double-digit import growth of the transition economies contrasts with the contraction in Latin American imports of 6.7%, the worst of all regions. Latin Americas exports rose moderately despite a steep contraction of its intra-regional trade, which was balanced by a rise of shipments to other areas. Africas exports and imports achieved small positive gains. Middle East exports are estimated to have decreased further in 2002 although at a smaller rate than in 2001. As the regions imports continued to grow, the large trade surplus of the Middle East eroded somewhat.
Trade developments by region
A notable feature of North Americas trade in 2002 was the poor
performance of its merchandise exports which decreased by 4%. A major
reason for this was the reduced demand from some of its key trading
partners because their economies were either hardly growing, such as
Western Europe and Japan, or in outright contraction, as in Latin
America. Lack of price competitiveness might have also played a major
role as US exports decreased even to those regions whose imports grew
strongly. US exports lost market share not only in developing Asia, the
transition economies, Western Europe and NAFTA but also in the
developing economies of Latin America, the Middle East and Africa.
However, imports continued to grow driven by continuing consumer
spending and an increasingly expansionary fiscal stance. Consumer
spending, particularly on durables, remained healthy because of low
inflation, tax relief and strength in the US housing market, which
partly offset stock market losses. North Americas export and import
prices decreased slightly in 2002 and contributed to sluggish growth in
merchandise trade in value terms. On the other hand, commercial services
trade recorded a better performance as exports rose by 3% and imports by
11% (5). Once again, there were big differences in the performance of the
three major services sectors. While travel and transportation services
shrank, that of other services saw double-digit import and export
growth.
Intra-North American trade declined marginally while exports to
crisis-ridden South America and stagnating Western European economies
decreased at double-digit rates. Imports from these regions, however,
increased slightly in 2002. Imports from Asia rose largely due to higher
shipments from China. United States imports from China increased by 22%
but those from Japan and the NICs(4) decreased. The steep decline of US
exports and imports from Japan, Hong Kong, China and Singapore point to
structural shifts in the US trade with Asian countries. For the first
time, China replaced Japan as the principal Asian supplier of
merchandise to the United States. Although US exports to China also rose
rapidly, the bilateral trade deficit widened sharply and reached almost
$103 billion, the largest with any country.
For the Latin American region, 2002 turned out to be one of the
most difficult years since the debt crisis of the 1980s. Private net
capital inflows to the region, which exceeded $60 billion in 1999 and
2000, had financed large current account deficits and supported economic
activity, investment and imports. But given the loss in confidence by
foreign investors in the sustainability of the economic policies of some
major countries in the region, there was a curtailment of net capital
inflows into the region. The reductions in inflows were first
compensated by a reduction in foreign exchange reserves and eventually
by devaluations ranging between 50% and 70% in the most affected
countries. (Early in January 2002, Argentina decided to abandon the
ten-year old parity link between the Argentinian peso and the US dollar
and devalued the peso by 30%. This decision triggered of a series of
further devaluations in the region.) Given that the level of many
commodity prices remained low in 2002, this limited the export earnings
of many countries in the region while the huge contraction in economic
activity significantly dampened imports.
The financial crisis in Argentina, the economic repercussions on its
MERCOSUR neighbours, and the civil unrest in Venezuela were the major
factors contributing to the contraction of Latin Americas merchandise
imports by nearly 7% in 2002. Argentina experienced a massive cut in
imports (55%), which exceeded even the worst import contractions during
the Asian financial crisis. The reduction in Latin Americas imports was
the largest of any of the seven major regions covered here and contrasts
with its trade performance in the 1990s when Latin Americas imports and
exports expanded much faster than the global average. Merchandise
exports rose slightly as falling intra-regional trade was offset by
rising exports to other regions. For the first time since 1991, Latin
Americas merchandise trade balance (as measured f.o.b.-f.o.b.) turned
positive again. Commercial services imports are estimated to have
decreased by more than 10% in 2002. In contrast to merchandise exports,
the regions commercial services exports experienced a contraction of
about 6%.
Chart 4
Diverging developments in MERCOSUR merchandise trade in 2002
(Billion dollars)
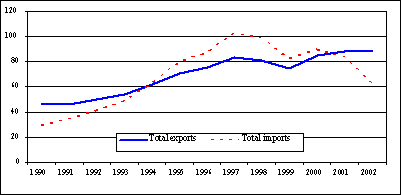
MERCOSUR countries increased their overall exports by 1% as the dramatic
contraction of intra-regional trade by one third was offset by an
increase in shipments to all other destinations by 5%. Brazil, the
country least dependent on intra-MERCOSUR trade, increased its total
merchandise exports by 4%. Back in 2000, intra-MERCOSUR trade had
accounted for about one fifth of both total exports and imports. But
given the huge economic difficulties experienced by the region in the
last few years, these shares have fallen quite precipitously. The intra-MERCOSUR
share has now been cut almost by half (from 20% to 11%) in the case of
exports.
Latin Americas merchandise exports increased slightly as the decline in
intra-regional trade was balanced by increased shipment to other
regions. The recovery of commodity prices in the course of the year and
the upturn in the US economy contributed to this rise. While most Latin
American countries saw a reduction or stagnation in their imports, those
of Costa Rica increased by 9%. Mexico benefited from the recovery of the
US market while for Costa Rica, the recovery in semi-conductor shipments
boosted both imports and exports. Despite the continuation of low prices
for many primary commodities, exports of many Central American and
Caribbean countries recovered strongly.
Economic activity in Western Europe remained subdued as Germany,
the largest economy in the region, experienced declining domestic demand
and several other countries faced sluggish domestic demand. In the
euro-zone, public consumption was the most dynamic expenditure category
while private consumption slowed down and fixed investment of the
enterprise sector fell nearly 3%.
Given the depreciation by about 5% of the US dollar vis-?vis the euro,
the pound and various other European currencies, Western European trade
performance, measured in dollar terms, concealed the stagnation in
volume terms. Western Europes merchandise exports in dollar terms
increased by 5.5% while the expansion of imports was limited to 3.5%. EU
imports from third countries languished while intra-regional trade rose
by 4.5%. The most dynamic part of EU trade was exports to third
countries which expanded by about 6%. Among the other Western European
countries, Switzerlands merchandise exports rose by 7% largely due to
the appreciation of the Swiss franc. The stagnation of the Swiss economy
left its imports unchanged from the preceding year. Turkeys imports
recovered strongly in 2002 from their contraction in the preceding year
while exports continued to expand at double-digit rates.
Commercial services exports of Western Europe, which account for nearly
one half of world services trade, increased by nearly 8%, somewhat
faster than imports, with exchange rate changes accounting for most of
this increase in dollar terms. Exports of transportation services
experienced the weakest growth while exports of other commercial
services had the most dynamic performance in 2002.
More than a decade after the fall of the Berlin Wall and the dissolution
of the Soviet Union, the transition economies are still
struggling with their transformation from planned to market-oriented
economies. One of the outstanding features of the transition process has
been the massive re-direction of trade flows from within the region to
trade with countries outside the region, and in particular, to Western
Europe. This shift in structure can be observed not only in the trade of
Central/Eastern Europe or the Baltic States but also in the Commonwealth
of Independent States (CIS) countries. Despite the relatively strong
economic growth in the region, the share of intra-regional trade in CIS
merchandise exports and imports declined to one third and one fifth
respectively.
Merchandise trade of transition economies was sustained by strong
domestic demand growth, above all in private consumption, and by rising
FDI inflows into Central/Eastern Europe. The regions merchandise and
commercial services imports rose at double-digit rates. Export growth
was somewhat less dynamic than imports but it was still two times faster
than the growth in world merchandise and commercial services trade.
Merchandise exports of the transition economies expanded by 8%, reaching
a new record level of $310 billion in 2002. The Russian Federation, the
leading trader in the region, recorded merchandise export gains of 3.5%
while 14 other transition economies recorded import growth in excess of
10%. Preliminary data suggest that the transition economies?commercial
services exports and imports rose by about 8% and 12% respectively in
2002.
The preliminary data available on Africas output and trade in
2002 do not indicate a reversal of past trends with respect to incomes
or participation in world trade. Average per-capita income levels
changed little and Africas trade growth lagged behind the global trade
expansion. Although various debt indicators improved and non-oil
commodity prices recovered somewhat from their depressed levels in 2001,
a broad-based expansion of output and trade has not yet occurred.
In 2002, Africas merchandise and commercial services trade lagged
behind the global trade expansion (6). Merchandise exports and imports
recorded only marginal gains. The African oil-exporters saw a further
decline in their exports (-3%) and a fall in their imports in the order
of 5 to 10%. South African exports and imports recovered by 2% to 3%
from the preceding years decline. Exports of the other non-oil
exporting African countries were probably much stronger and expanded by
about 6%. A strong rebound in exports in 2002 from the preceding years
decline in a number of countries (including Morocco, Egypt, Côte
dº´voire and Ghana) accounted for most of this strength in the export
growth of non-oil exporters in Africa. However, it is estimated that
only six out of 53 African countries achieved a sustained expansion of
their exports over the 1999-2002 period (7). Africas overall merchandise
import growth was held back by the import contraction in Nigeria and
Egypt, the third and second largest merchandise importers in Africa in
2001. In at least 15 other African countries however, there was
double-digit import growth.
Table 2
Growth in the value of merchandise trade by region, 1990-2002
(Billion dollars and percentage)
| Exports | Imports | |||||||
| Value | Annual percentage change | Value | Annual percentage change | |||||
| 2002 | 1990?000 | 2001 | 2002 | 2002 | 1990?000 | 2001 | 2002 | |
|
World |
6 240 | 6 | ? | 4 | 6 501 | 6 | ? | 3 |
|
North America |
946 | 7 | ? | ? | 1 431 | 9 | ? | 2 |
|
United States |
694 | 7 | ? | ? | 1 202 | 9 | ? | 2 |
|
Latin America |
351 | 9 | -3 | 1 | 355 | 12 | -2 | -7 |
|
Mexico |
161 | 15 | -5 | 1 | 176 | 15 | -4 | 0 |
|
MERCOSUR |
88 | 6 | 4 | 1 | 62 | 12 | -6 | -26 |
|
Other Latin |
102 | 6 | -7 | 0 | 116 | 7 | 3 | -3 |
|
Western Europe |
2 648 | 4 | 0 | 5 | 2 644 | 4 | -2 | 4 |
|
European Union (15) |
2 441 | 4 | 0 | 5 | 2 438 | 4 | -2 | 3 |
|
Excl. intra-EU trade |
939 | 5 | 1 | 6 | 931 | 5 | -4 | 1 |
|
Intra-EU trade |
1 502 | 4 | -1 | 5 | 1 507 | 4 | -1 | 5 |
|
Transition economies |
309 | 10 | 5 | 8 | 297 | 8 | 11 | 10 |
|
Central/Eastern |
145 | 10 | 12 | 12 | 176 | 12 | 9 | 10 |
|
Russian Federation |
107 | - | -2 | 4 | 60 | - | 20 | 12 |
|
|
||||||||
|
Africa |
139 | 3 | -6 | 1 | 133 | 3 | 2 | 1 |
|
|
||||||||
|
Middle East |
236 | 6 | -7 | -2 | 183 | 5 | 4 | 2 |
|
|
||||||||
|
Asia |
1 610 | 8 | -9 | 8 | 1 457 | 8 | -7 | 6 |
|
Japan |
416 | 5 | -16 | 3 | 336 | 5 | -8 | -4 |
|
Developing Asia |
1 114 | 11 | -7 | 10 | 1 033 | 9 | -7 | 9 |
|
China |
326 | 15 | 7 | 22 | 295 | 16 | 8 | 21 |
|
IT traders (6) a |
618 | 10 | -13 | 7 | 561 | 9 | -13 | 6 |
|
|
||||||||
|
Memorandum |
1 841 | 9 | -7 | 6 | 1 704 | 9 | -4 | 4 |
|
Developing economies |
1 841 | 9 | -7 | 6 | 1 704 | 9 | -4 | 4 |
|
LDCs |
38 | 7 | 1 | 4 | 45 | 5 | 4 | 3 |
a Chinese Taipei, the Rep. of Korea, Malaysia, Philippines, Singapore and Thailand.
In 2002, the Middle Easts trade and output growth was curbed by
a fall in the regions oil production and growing political tensions. As
fuels account for more than three quarters of the regions merchandise
exports, a decline in oil output has immediate repercussions on export
revenues. One notable feature of Middle East trade in recent years is
the increased orientation of its exports to Asia, to which more than one
half of the regions fuels exports are shipped.
Merchandise and commercial services trade of the Middle East lagged
behind world trade growth in 2002. Merchandise exports of the region are
estimated to have decreased only slightly despite lower exports from
various large oil exporters in the region. This is due to a number of
smaller traders who reported double-digit export growth. Given the
rising tensions in the region, earnings from tourism suffered, leading
to an overall decline in the commercial exports of the region estimated
at about 4%. In Israel both exports and imports continued to be at
depressed levels.
In 2002, trade developments in Asia were shaped by the diverging
growth paths between Japan, still Asias largest economy, and China and
India, the two most populous nations in the world. While Japanese
domestic demand stagnated, China and India continued to grow rapidly.
ASEAN countries and other East Asian economies also experienced stronger
economic growth in 2002 compared to the preceding year, but for most of
them, the expansion was less than the rates of growth achieved in the
early nineties.
Table 3
Growth in the value of commercial services trade by region, 1990-2002
(Billion dollars and percentage)
|
|
Exports | Imports | ||||||
|
|
Value |
Annual percentage change |
Value |
Annual percentage change |
||||
|
|
2002 |
1990?000 |
2001 |
2002 |
2002 |
1990?000 |
2001 |
2002 |
|
World |
1538 | 7 | ? | 5 | 1522 | 6 | ? | 5 |
|
|
||||||||
|
North America |
304 | 7 | ? | 3 | 260 | 7 | ? | 11 |
|
United States |
268 | 7 | ? | 3 | 218 | 8 | ? | 13 |
|
|
||||||||
|
Latin America |
55 | 7 | ? | ? | 63 | 7 | 0 | ?2 |
|
Mexico |
13 | 7 | ? | 0 | 16 | 5 | ? | ? |
|
MERCOSUR |
13 | 8 | ? | ?3 | 19 | 10 | ? | ?6 |
|
Other Latin America |
30 | 7 | 1 | ? | 28 | 7 | 3 | ? |
|
Western Europe |
744 | 5 | 1 | 7 | 695 | 5 | 2 | 6 |
|
European Union (15) |
673 | 5 | 2 | 8 | 651 | 6 | 3 | 6 |
|
|
||||||||
|
Transition economies |
58 | ?/span> | 7 | 8 | 63 | ?/span> | 11 | 12 |
|
Central/Eastern Europe |
33 | ?/span> | 6 | 3 | 29 | ?/span> | 7 | 12 |
|
Russian Federation |
12 | ?/span> | 10 | 18 | 21 | ?/span> | 12 | 13 |
|
Africa |
29 | 5 | 1 | ? | 40 | 4 | 4 | 1 |
|
Middle East |
32 | 9 | ? | ? | 47 | 4 | ? | 3 |
|
Asia |
316 | 9 | ? | 5 | 354 | 7 | ? | 1 |
|
Japan |
65 | 5 | ? | 2 | 105 | 3 | ? | ? |
|
Developing Asia |
230 | 11 | 2 | 6 | 227 | 11 | ? | 2 |
|
China |
37 | 18 | 9 | 13 | 44 | 24 | 9 | 13 |
|
Hong Kong, China |
44 | 8 | 2 | 6 | 24 | 8 | ? | ? |
|
Korea, Rep. of |
29 | 13 | 0 | ? | 34 | 13 | 0 | 2 |
|
Singapore |
27 | 8 | ? | 3 | 21 | 10 | ? | 1 |
|
Memorandum item: |
|
|
|
|
|
|
|
|
|
Developing countries |
346 | 9 | 0 | 2 | 377 | 8 | ? | ? |
|
LDCs |
6 | 6 | ? | 5 | 16 | 4 | 13 | 4 |
Asias merchandise trade showed a vigorous recovery in the course of
2002, but the level of trade was still lower than in 2000. Commercial
services trade was less dynamic than merchandise trade in 2002 with
exports up by 5% and imports advancing only marginally. While the
deflation of the IT boom was the largest single factor leading to the
sharp fall of Asias exports in 2001, the moderate output gains in this
sector were a major element in the 2002 recovery. The six Asian
economies with a high share of electronic goods in their exports
benefited from the recovery in the IT sector. However, the rebound of
their exports and imports of about 6% was not strong enough to offset
fully the severe contraction experienced in 2001.
Two main features left their mark on Japans trade in 2002. Weak
domestic demand and the depreciation of the yen vis-?vis the US dollar
on an annual average basis favoured export over import growth and led to
a decline of both dollar export and import prices. Consequently, the
recovery in the dollar value of Japans merchandise exports was limited
to 3% and imports contracted further by nearly 4%. The second
outstanding feature in Japans trade in 2002 was the sharp increase in
its bilateral flows with China. Japans exports to China rose by 20%
while its imports increased by 7%. Last year China replaced the United
States as Japans largest supplier of goods.
Chinas export and import growth accelerated sharply during the year.
For 2002 as a whole, merchandise exports and imports increased by more
than 20%, while in the fourth quarter of 2002, trade value exceeded by
one third that of the corresponding period in 2001. The boom in Chinas
trade can be attributed largely to the record investment inflows in
2002, which in the past were largely directed to its export sector.
Trade liberalization in the automobile sector caused a fall in domestic
prices which contributed to a large increase in demand for passenger
cars, a surge in imports of automotive products (an increase of 40% in
value terms) together with a huge increase in domestic production. On
trade in agriculture, Chinas exports of agricultural products increased
(in value terms) at 13%, faster than its imports, which grew at 8.5%. In
many ways, the momentum of Chinas ascendancy in Asia continued last
year as a result of its continuing high growth, increasing FDI inflows
and the outstanding expansion of its trade. Chinas trade expansion last
year accounted for more than one fifth of the increase in world
merchandise exports (and imports). China has not only become a major
supplier but also a prominent market for many countries (8). Having
overtaken the UK in 2002, it now ranks as the worlds fifth largest
merchandise trader.
Another interesting feature of Asias trade has been the relatively less
dynamic performance of Singapore and Hong Kong, China in recent years.
This can be attributed to at least two factors. First, both Singapore
and Hong Kong, China have become high income economies which have lost
their competitive edge in many of their traditional exports of
manufactured goods and have therefore shifted their economic development
strategies to the services sector. Following a double-digit decrease in
2001, domestic exports of Hong Kong, China contracted by 18% while those
of Singapore recovered by only 1.5%. Second, within the services sector,
these economies?position as regional distribution/transit centres is
being challenged by their neighbours.
Prospects for 2003
At the time of writing (April 2003) the war in the Middle East is
clouding short term prospects for the world economy. Projections on the
course of global output and trade depend strongly on the developments in
the conflict in Iraq. Even in a best-case scenario of a short war, much
depends on how quickly political stability can be re-established in Iraq
and maintained throughout the region. In this best-case scenario for the
global economy, one could expect a decline in oil prices from their
current crisis level of 33 dollars per barrel which would provide a
stimulus to global economic activity.
The impact of a military conflict in the Middle East could also pose a
challenge to international relations which go far beyond the questions
of oil supplies and regional stability. Military intervention could have
the effect of testing the whole system of international institutions and
agreements, which have until now provided the basis for global
governance, ushering in a new and more uncertain era in international
relations (9). The erosion of confidence in global institutions could
encourage the creation of like-minded blocs and inward-looking policies.
The observed slowdown in economic expansion in the industrial economies
in the last quarter of 2002, the continued sluggishness of business and
consumer confidence in the first months of 2003, reflected also in weak
stock markets, together with higher oil prices call for a downgrading of
the economic projections made in late 2002 which predicted a moderate
acceleration in global output growth and a significant rise in global
trade on a year to year basis. In the light of the recent exchange rate
developments ?in particular the strong appreciation of the euro and yen
vis-?vis the US dollar ?growth projections need to be lowered for the
EU and Japan, and raised for the United States, thereby increasing
further the projected gap in demand growth among these economies.
Global trade flows are projected to expand by less than 3% in 2003. On the assumption
that trade growth remains weak but positive in the first quarter of 2003
and picks up at a moderate rate thereafter ?as economic activity
strengthens on a world-wide basis ?the year to year trade expansion is
expected to be in the range of 2%-3%. This rate of trade growth would be lower than the average rate recorded in the 1990s.
On the WTO website
> Last years press release (2 May 2002):
Trade to pick up slightly in 2002
after sharp drop in 2001
> Press release on latest International Trade Statistics (7 October
2002)
Supachai: disappointing trade figures
underscore importance of accelerating trade talks
> Trade statistics gateway
> WTO economic research and
analysis
Appendix Table 1
Leading exporters and importers in world merchandise trade, 2002
(Billion dollars and percentage)
|
Rank |
Exporters |
Value |
Share |
Annual |
Rank |
Importers |
Value |
Share |
Annual % change |
|
1 |
United States |
693.5 |
10.8 |
-5 |
1 |
United States |
1 202.5 |
18.0 |
2 |
|
2 |
Germany |
612.2 |
9.5 |
7 |
2 |
Germany |
493.3 |
7.4 |
1 |
|
3 |
Japan |
416.0 |
6.5 |
3 |
3 |
United Kingdom |
339.8 |
5.1 |
2 |
|
4 |
France |
329.5 |
5.1 |
2 |
4 |
Japan |
336.4 |
5.0 |
-4 |
|
5 |
China |
325.6 |
5.1 |
22 |
5 |
France |
326.4 |
4.9 |
-1 |
|
6 |
United Kingdom |
275.9 |
4.3 |
1 |
6 |
China |
295.2 |
4.4 |
21 |
|
7 |
Canada |
252.5 |
3.9 |
-3 |
7 |
Italy |
241.1 |
3.6 |
4 |
|
8 |
Italy |
252.0 |
3.9 |
5 |
8 |
Canada |
227.6 |
3.4 |
0 |
|
9 |
Netherlands |
243.4 |
3.8 |
5 |
9 |
Netherlands |
217.7 |
3.3 |
4 |
|
10 |
Belgium |
213.2 |
3.3 |
12 |
10 |
Hong Kong, China |
208.6 |
3.1 |
3 |
|
|
|
|
|
|
retained imports a |
24.7 |
0.4 |
-21 |
|
|
|
|
|
|
|
|
|
|
|
|
|
11 |
Hong Kong, China |
200.6 |
3.1 |
5 |
11 |
Belgium |
195.7 |
2.9 |
10 |
|
|
domestic exports |
16.7 |
0.3 |
-18 |
12 |
Mexico |
176.5 |
2.6 |
0 |
|
|
re-exports |
183.9 |
2.9 |
8 |
13 |
Spain |
153.7 |
2.3 |
-1 |
|
12 |
Korea, Rep. of |
162.5 |
2.5 |
8 |
14 |
Korea, Rep. of |
152.1 |
2.3 |
8 |
|
13 |
Mexico |
160.8 |
2.5 |
1 |
15 |
Singapore |
116.2 |
1.7 |
0 |
|
14 |
Chinese Taipei |
130.3 |
2.0 |
6 |
retained imports |
57.7 |
0.9 |
-5 |
|
|
15 |
Singapore |
125.6 |
2.0 |
3 |
16 |
Chinese Taipei |
112.6 |
1.7 |
5 |
|
|
domestic exports |
67.0 |
1.0 |
1 |
17 |
Switzerland |
83.5 |
1.2 |
-1 |
|
|
re-exports |
58.6 |
0.9 |
5 |
18 |
Malaysia |
80.2 |
1.2 |
9 |
|
16 |
Spain |
118.9 |
1.9 |
2 |
19 |
Austria |
77.7 |
1.2 |
4 |
|
17 |
Russian Fed. |
106.9 |
1.7 |
4 |
20 |
Australia |
72.7 |
1.1 |
14 |
|
18 |
Malaysia |
95.7 |
1.5 |
9 |
|
|
|
|
|
|
19 |
Ireland |
88.6 |
1.4 |
7 |
|
|
|
|
|
|
20 |
Switzerland |
87.6 |
1.4 |
7 |
|
|
|
|
|
|
|
|
|
|
|
|
|
|
|
|
|
21 |
Sweden |
80.7 |
1.3 |
7 |
21 |
Sweden |
65.9 |
1.0 |
4 |
|
22 |
Austria |
79.1 |
1.2 |
12 |
22 |
Thailand |
64.5 |
1.0 |
4 |
|
23 |
Saudi Arabia |
73.9 |
1.2 |
1 |
23 |
Russian Fed. |
60.0 |
0.9 |
12 |
|
24 |
Thailand |
68.6 |
1.1 |
5 |
24 |
India |
56.3 |
0.8 |
12 |
|
25 |
Australia |
65.0 |
1.0 |
3 |
25 |
Poland |
54.8 |
0.8 |
9 |
|
26 |
Brazil |
60.4 |
0.9 |
4 |
26 |
Ireland |
51.9 |
0.8 |
3 |
|
27 |
Norway |
60.3 |
0.9 |
2 |
27 |
Brazil |
49.5 |
0.7 |
-15 |
|
28 |
Denmark |
56.8 |
0.9 |
10 |
28 |
Denmark |
49.2 |
0.7 |
9 |
|
29 |
Indonesia |
52.0 |
0.8 |
0 |
29 |
Turkey |
48.8 |
0.7 |
18 |
|
30 |
India |
50.0 |
0.8 |
15 |
30 |
Czech Rep. b |
40.6 |
0.6 |
11 |
|
|
|
|
|
|
|
|
|
|
|
|
|
Total of above c |
5 538 |
86.2 |
- |
|
Total of above c |
5 651 |
84.5 |
- |
|
|
World c |
6 424 |
100.0 |
4 |
|
World c |
6 685 |
100.0 |
3 |
a Retained imports are defined as imports less re-exports.
b Imports are valued f.o.b.
c Includes significant re-exports or imports for re-export.
Appendix Table 2
Leading exporters and importers in world trade in commercial
services, 2002
(Billion dollars and percentage)
| Rank | Exporters | Value | Share | Annual % change | Rank | Importers | Value | Share | Annual % change |
|
1 |
United States |
267.8 |
17.4 |
3 |
1 |
United States |
218.4 |
14.3 |
13 |
|
2 |
United Kingdom |
121.0 |
7.9 |
10 |
2 |
Germany |
142.8 |
9.4 |
4 |
|
3 |
Germany |
94.9 |
6.2 |
14 |
3 |
Japan |
105.3 |
6.9 |
-2 |
|
4 |
France |
84.0 |
5.5 |
5 |
4 |
United Kingdom |
98.0 |
6.4 |
6 |
|
5 |
Japan |
64.7 |
4.2 |
2 |
5 |
France |
64.3 |
4.2 |
4 |
|
6 |
Spain |
61.1 |
4.0 |
6 |
6 |
Italy |
61.7 |
4.0 |
11 |
|
7 |
Italy |
58.7 |
3.8 |
3 |
7 |
Netherlands |
55.9 |
3.7 |
5 |
|
8 |
Netherlands |
54.7 |
3.6 |
5 |
8 |
Belgium-Luxembourg |
47.9 |
3.1 |
12 |
|
9 |
Belgium-Luxembourg |
53.3 |
3.5 |
9 |
9 |
China |
44.2 |
2.9 |
... |
|
10 |
Hong Kong, China |
44.0 |
2.9 |
6 |
10 |
Canada |
41.7 |
2.7 |
0 |
|
|
|
|
|
|
|
|
|
|
|
|
11 |
China |
37.3 |
2.4 |
... |
11 |
Ireland |
38.8 |
2.5 |
12 |
|
12 |
Canada |
36.2 |
2.4 |
2 |
12 |
Spain |
36.2 |
2.4 |
9 |
|
13 |
Austria |
36.1 |
2.3 |
11 |
13 |
Korea, Rep. of |
33.9 |
2.2 |
2 |
|
14 |
Korea, Rep. of |
29.3 |
1.9 |
-1 |
14 |
Austria |
33.8 |
2.2 |
8 |
|
15 |
Switzerland |
27.3 |
1.8 |
5 |
15 |
Denmark |
24.6 |
1.6 |
5 |
|
16 |
Singapore |
27.0 |
1.8 |
3 |
16 |
Chinese Taipei |
24.4 |
1.6 |
3 |
|
17 |
Denmark |
26.9 |
1.8 |
0 |
17 |
Hong Kong, China |
23.9 |
1.6 |
-2 |
|
18 |
Ireland |
26.2 |
1.7 |
31 |
18 |
Sweden |
23.1 |
1.5 |
1 |
|
19 |
Sweden |
22.0 |
1.4 |
1 |
19 |
Russian Fed. |
20.7 |
1.4 |
13 |
|
20 |
Chinese Taipei |
21.3 |
1.4 |
10 |
20 |
Singapore |
20.6 |
1.4 |
1 |
|
|
|
|
|
|
|
|
|
|
|
|
21 |
India |
20.7 |
1.3 |
8 |
21 |
Australia |
17.0 |
1.1 |
3 |
|
22 |
Greece |
18.9 |
1.2 |
-3 |
22 |
Norway |
16.5 |
1.1 |
8 |
|
23 |
Norway |
18.8 |
1.2 |
5 |
23 |
Mexico |
16.4 |
1.1 |
-1 |
|
24 |
Australia |
16.0 |
1.0 |
1 |
24 |
Thailand |
16.3 |
1.1 |
13 |
|
25 |
Thailand |
14.9 |
1.0 |
16 |
25 |
Indonesia |
15.7 |
1.0 |
... |
|
26 |
Turkey |
14.4 |
0.9 |
-10 |
26 |
Malaysia |
15.6 |
1.0 |
-5 |
|
27 |
Malaysia |
14.1 |
0.9 |
-2 |
27 |
India |
15.5 |
1.0 |
-14 |
|
28 |
Mexico |
12.6 |
0.8 |
0 |
28 |
Switzerland |
15.3 |
1.0 |
1 |
|
29 |
Russian Fed. |
12.4 |
0.8 |
18 |
29 |
Brazil |
13.6 |
0.9 |
-14 |
|
30 |
Poland |
9.8 |
0.6 |
0 |
30 |
Israel |
12.5 |
0.8 |
1 |
|
|
|
|
|
|
|
|
|
|
|
|
|
Total of above |
1 345.0 |
87.5 |
6 |
|
Total of above |
1 315.0 |
86.4 |
6 |
|
|
World |
1 540.0 |
100.0 |
5 |
|
World |
1 520.0 |
100.0 |
5 |
Notes:
(1)
In mid 2002, capacity utilization rates in the manufacturing
sector in the US, Japan and the euro zone were still well below the
average utilization rates recorded on average in the 1990s.
back to text
(2)
UN, Economic Commission for Latin America and the Caribbean (ECLAC),
Preliminary Overview of the Economies of Latin American and the
Caribbean 2002, 2003.
back to text
(3)
According to industry sources, global sales of electronic
equipment and IT hardware decreased by about 5% while sales of
semi-conductor plant equipment decreased by more than 20% in 2002.
back to text
(4)
US Department of Commerce, Commerce News FT-900-12, Exhibit
11, p. 16.
back to text
(5)
Most of this increase is linked to the rise in US imports of
insurance services which recovered from the fallout of insurance
payments linked to the damages caused by the terrorist attacks of 11 September 2001.
back to text
(6)
At the time of writing (in early March 2003) only four
African countries have reported full year data on their merchandise
trade.
back to text
(7)
The six countries are: Equatorial Guinea, Lesotho,
Mozambique, Seychelles, Sierra Leone and Tanzania.
back to text
(8)
For eight developing countries China was the principal export
market in 2001 and for five other economies, the second largest market.
back to text
(9)
See Martin Wolf, America may not like the new world it is
about to create,?Financial Times, 12 March 2003.
back to text